Distance-Time Graphs
11SCI - Mechanics
Finn Le Sueur
2024
Mahi Tuatahi
sciPad page 10. Q1-2
Distance-Time Graphs
- We can plot a graph with time on the x-axis and distance on the y-axis to help us visualise data.
- Distance-time graphs tell us about the velocity of the object!

Interpreting Distance-Time Graphs

- Positive gradient: Moving away
- Flat gradient: Stationary
- Negative gradient: Moving towards
Interpreting Distance-Time Graphs
In pairs, describe the velocity of the object at A, B, C, D and E?

Calculating Velocity From Graphs

\[ \begin{aligned} v &= \text{ gradient} \cr v &= \frac{rise}{run} \cr v &= \frac{\Delta d}{\Delta t} = \frac{d_{f} - d_{i}}{t_{f} - t_{i}} \cr \end{aligned} \]
e.g. \[ \begin{aligned} v_{A} &= \frac{d_{f} - d_{i}}{t_{f} - t_{i}} = \frac{30000 - 0}{3600 - 0} \cr v_{A} &= 8.33ms^{-1} \end{aligned} \]
Question
In pairs, calculate the velocity of the object at A, B, C, D and E? Make sure you show working.

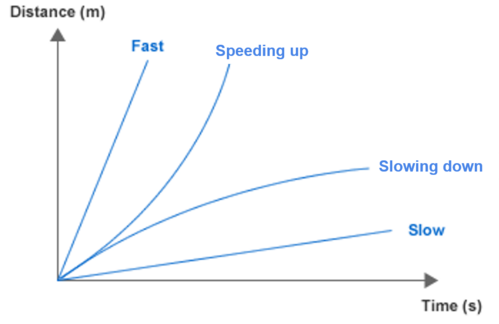
Curved Distance-Time Graph

Sketch this into your book
Mahi Kāinga / Homework
- Due Monday, March 21st: Mahi Kāinga Booklet Q2, Q3, Q1
- Now:
- sciPad page 11 Q1,
- sciPad page 13 Q4,
- sciPad page 14 Q1
- Homework Booklet Q4
When you have finished those questions you may use the rest of the period to do schoolwork of your choice!