Graphing
9SCIE - Introduction to Pūtaiao
2024
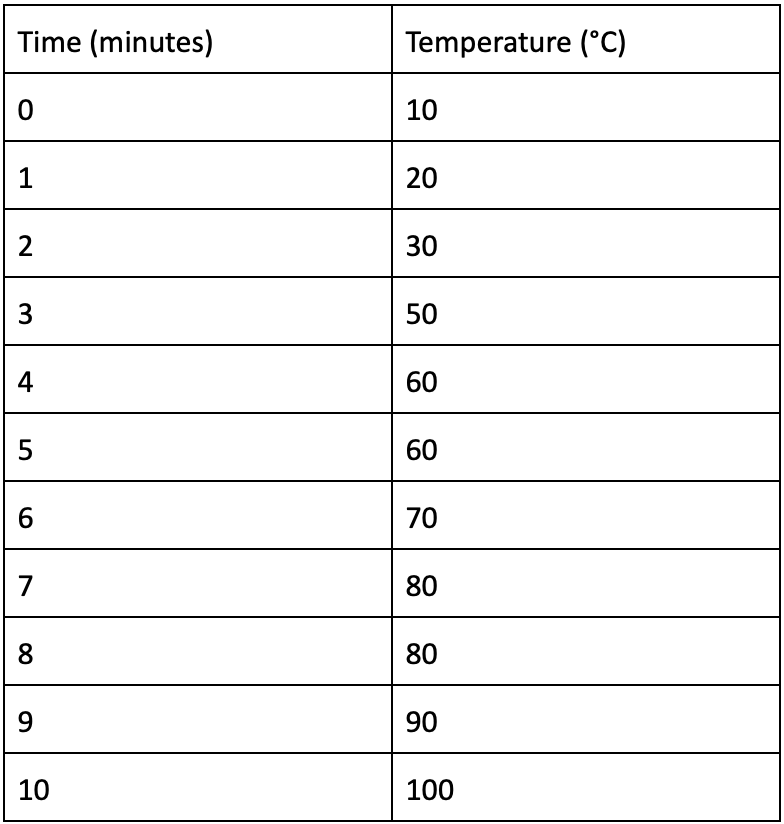
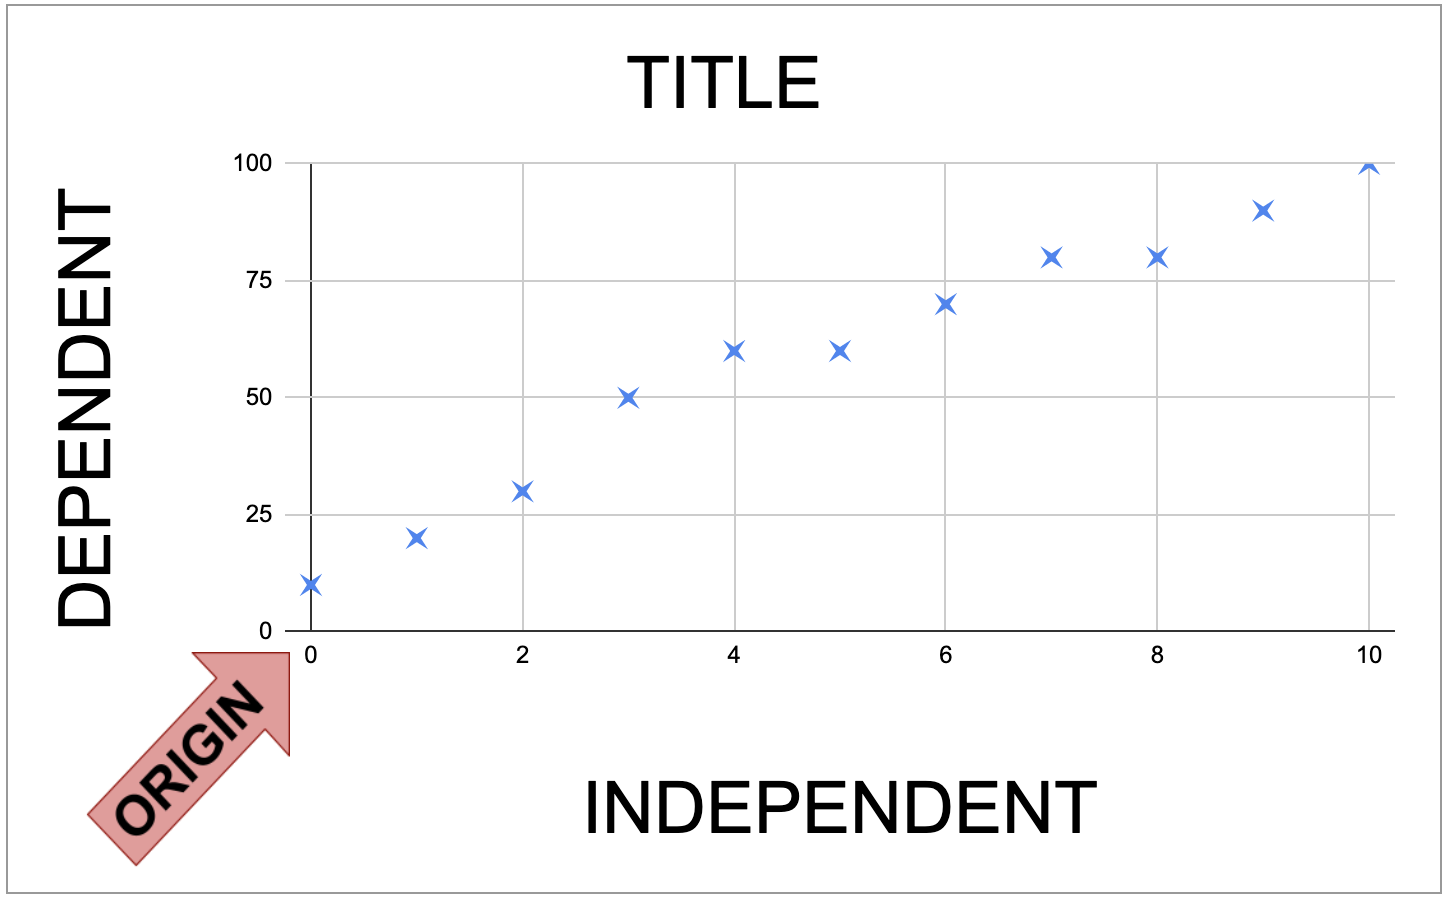
X and Y Axes
- The x-axis has the independent variable
- The thing you change
- The y-axis has the dependent variable
- The thing that you measure
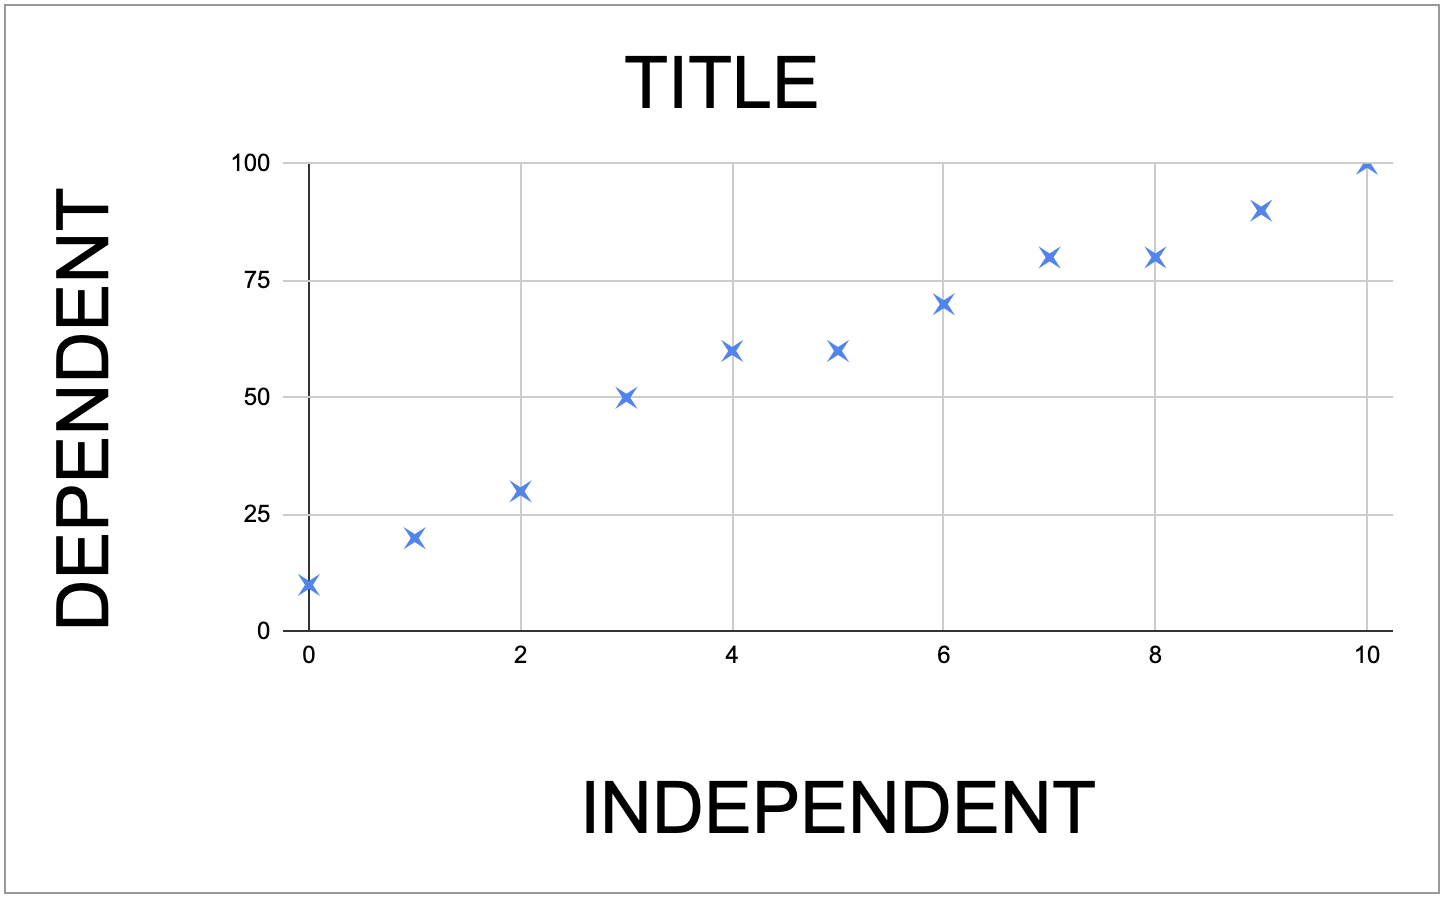
Labelling the Axes
- Title each axis
- Give each axis a unit
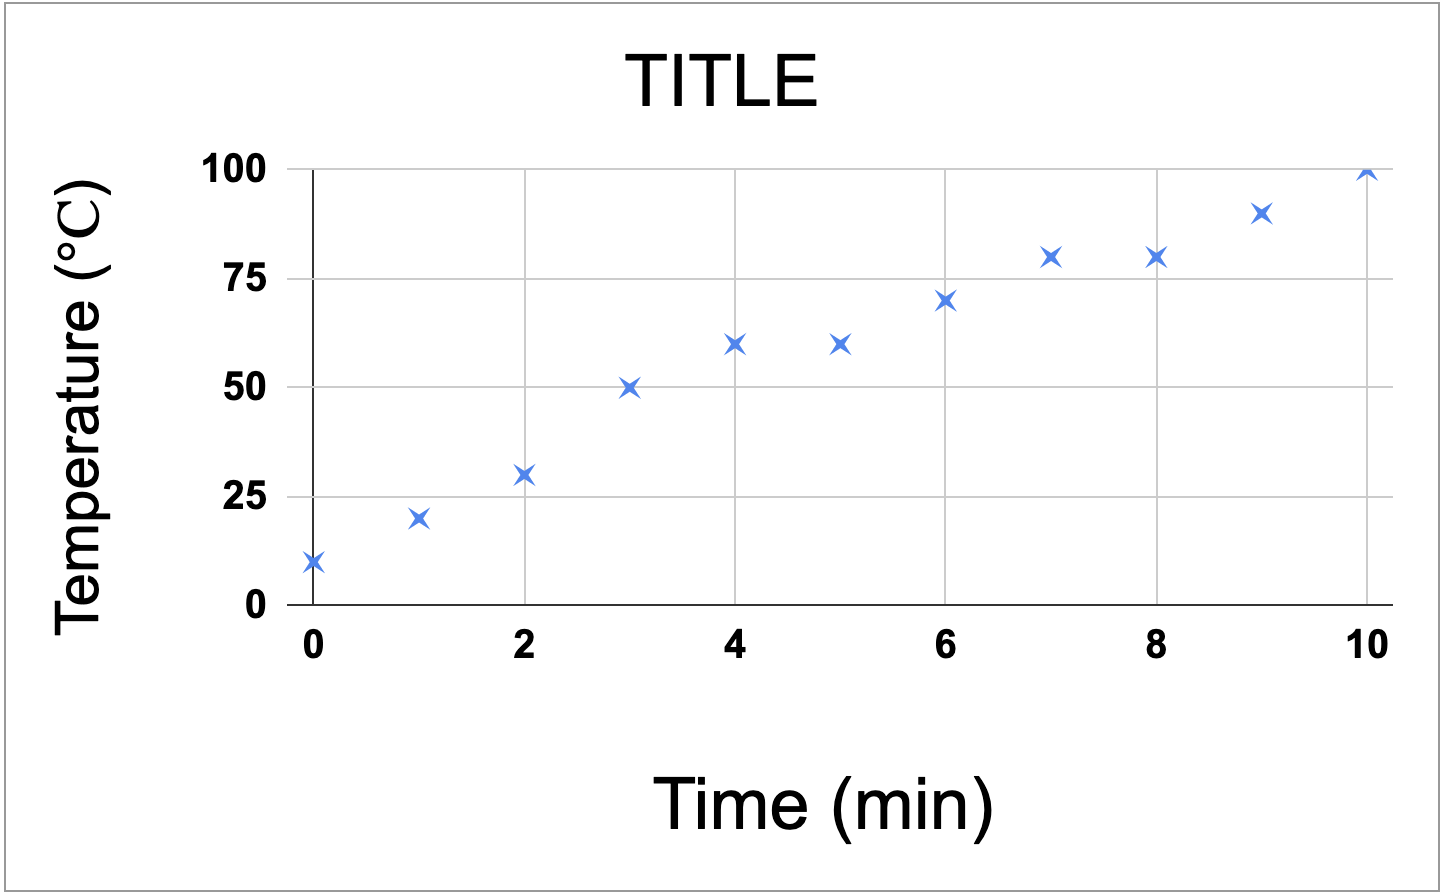
Title Your Graph
- Give your graph a descriptive title
The Origin
- Both axes should start at zero
- This is called the origin
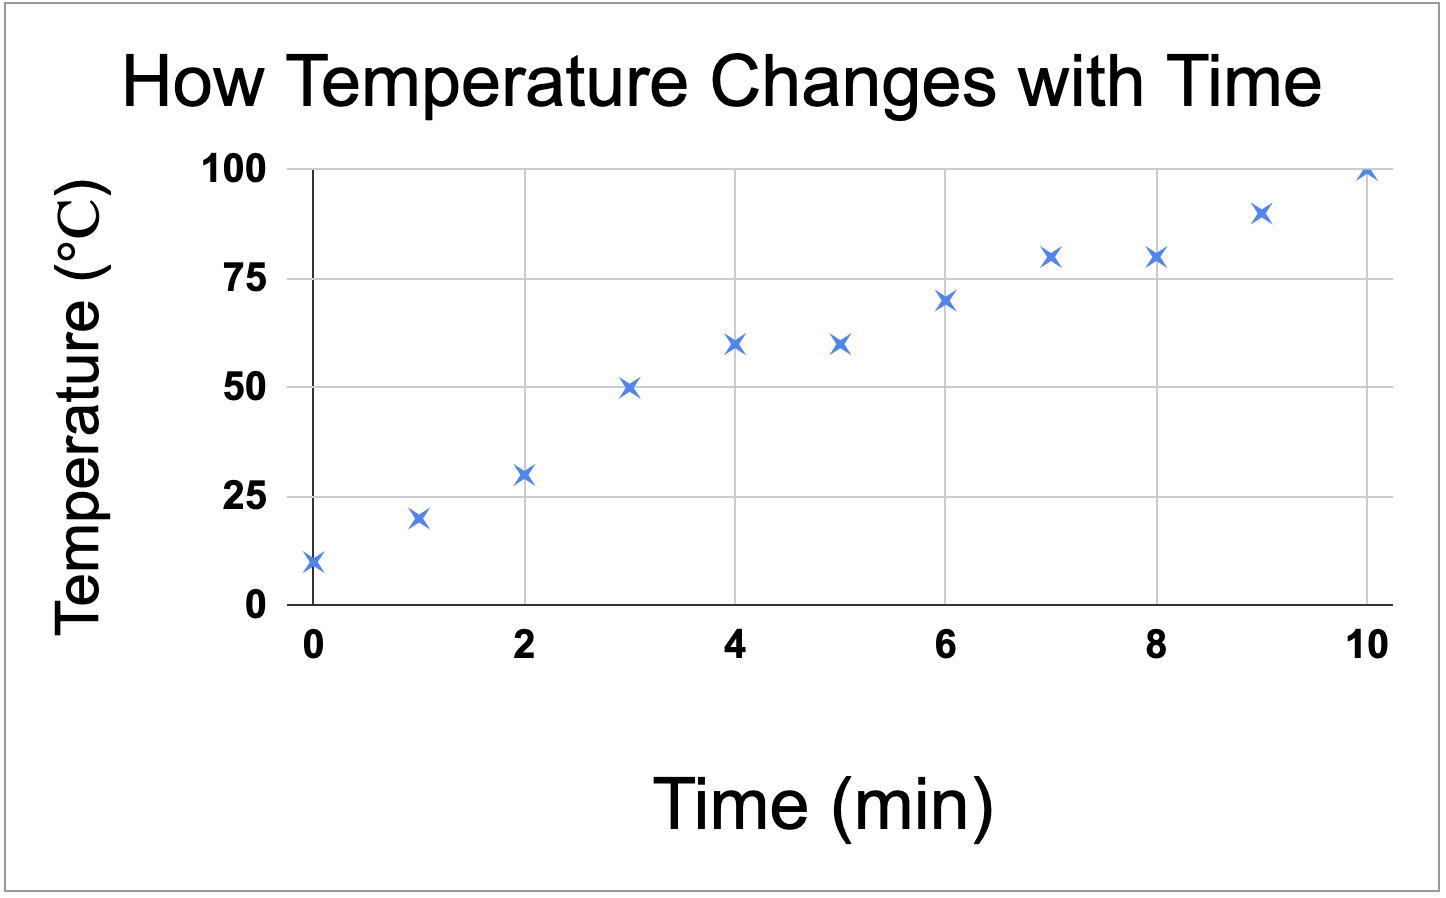
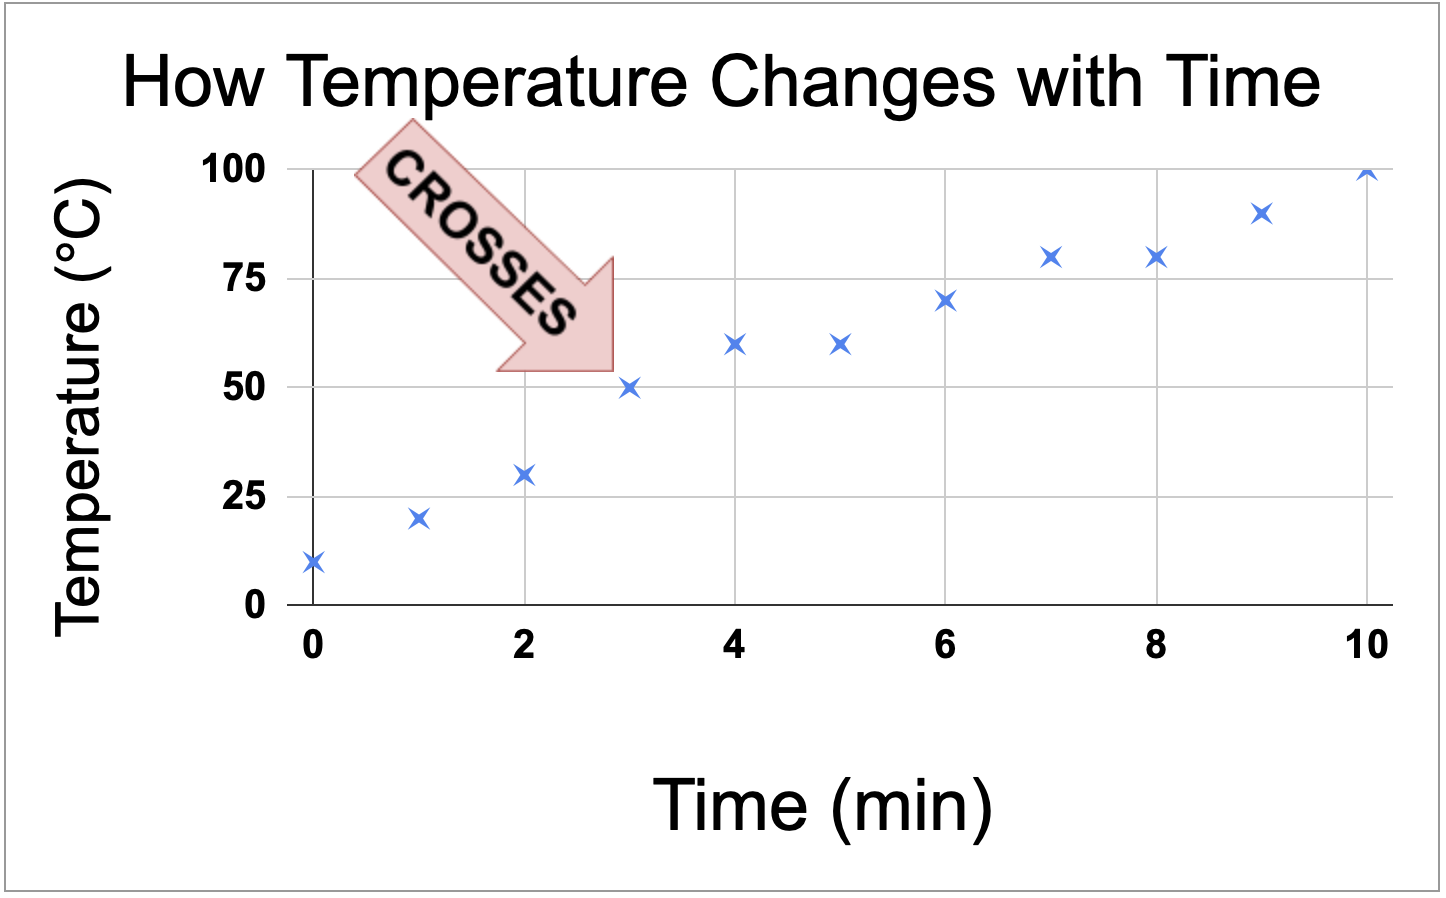
Adding Data Points
- Use crosses, not circles or anything else!
- Like battleships! Data points line up exactly with the axis
Trendline / Line of Best Fit
- Goes through or nearby most points
- Shows the general trend of the data
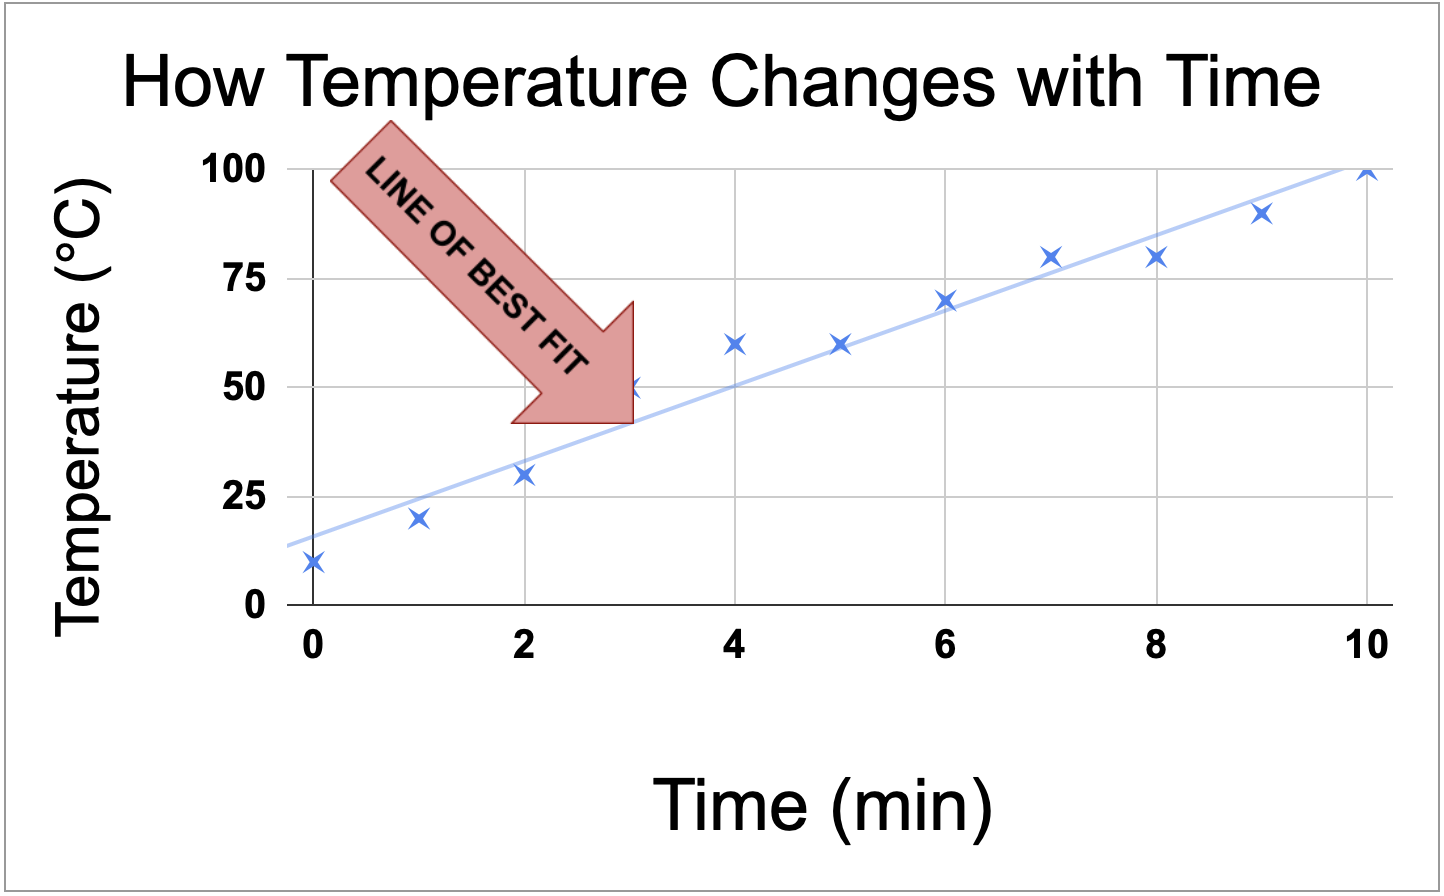
Heating Water Graph